
Go Benchmarks Are Too Flaky to Fail a Build: Use Allocation Budgets Instead
A benchmark on a shared CI runner measures your code and the machine it landed on, so the threshold ends up too loose to catch a tenfold regression. An allocation count does not move with the machine or the load. It does move with the Go release, which I found out the way everyone does.
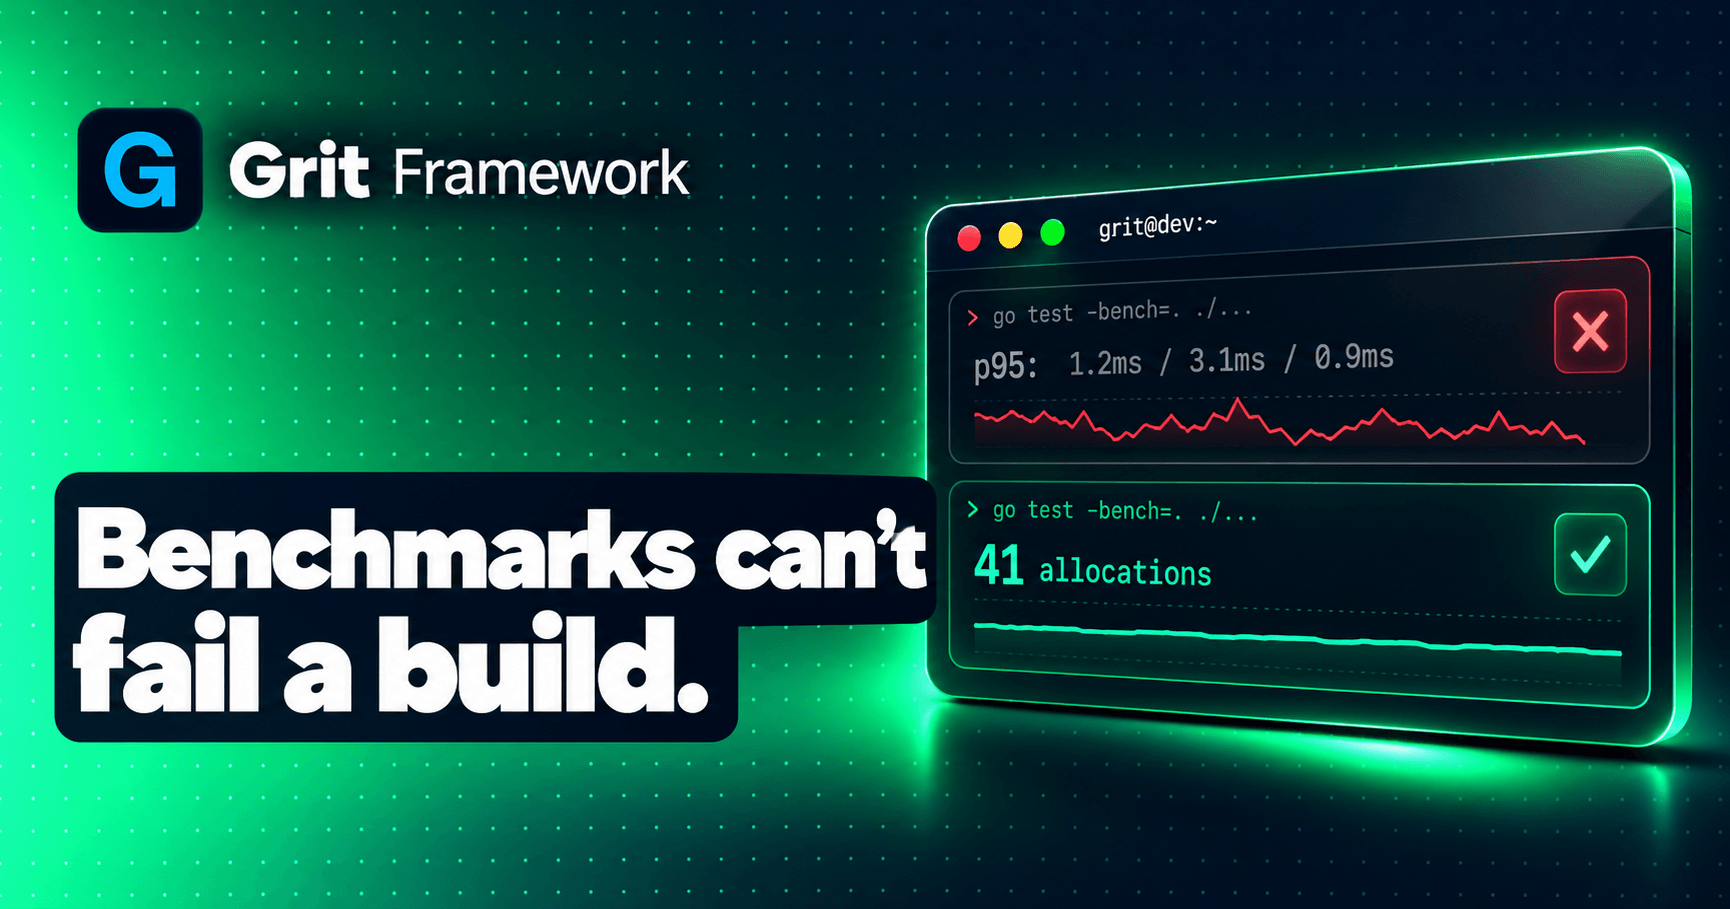
Most projects have benchmarks nobody runs.
The reason is structural rather than lazy. You write BenchmarkVerifyToken, it reports 1.2µs, and you think: good, now let me fail the build if it goes above 2µs. Then CI runs it on a shared runner next to three other jobs and it reports 3.1µs. You raise the threshold. It reports 0.9µs on a quiet afternoon and 4µs on a busy one. Within a week the threshold is so loose it would not catch a tenfold regression, and shortly after that the benchmarks stop being run at all.
A wall-clock benchmark measures your code and the machine it ran on. On a shared CI runner the second term dominates, so the measurement cannot be an assertion.
There is a number right next to it that does not have that problem.
Allocation counts hold still
got := testing.AllocsPerRun(200, func() {svc.ValidateAccessToken(token)})
AllocsPerRun runs the function N times and returns the average number of heap allocations per run. It does not measure time. It counts events.
And the count does not move with the machine. A loaded runner does not make your code allocate more. Four other jobs on the same box do not change how many times make is called. Run it on a laptop, run it on CI, run it at 3am or during a deploy storm: the same code allocates the same number of times.
That makes it the thing a benchmark cannot be: an assertion with a stable expected value.
It is also not a proxy for a thing nobody cares about. Most Go performance work is allocation work. Allocations are what produce garbage, garbage is what produces collection pauses, and collection pauses are what produce the p99 that wakes someone up. A change that doubles allocations on a hot path will not fail any test you have, and it will show up in your garbage collector.
The three paths worth a budget
Every project Grit generates ships internal/handlers/perf_test.go with budgets on three paths, chosen because they run on every request or every list request:
{name: "verify an access token",max: 70,why: "runs on every authenticated request, so this one is multiplied by all of your traffic",run: func() {svc.ValidateAccessToken(token)},},{name: "bind list parameters",max: 50,why: "runs on every list request, and grows quietly as query parameters are added",},{name: "write a list response",max: 46,why: "runs on every response; serialisation is usually the largest single allocator in a request",},
The why field is not decoration. It is printed in the failure message, because the person who trips this budget is usually not the person who set it, and "this allocates more than it used to" is not actionable without "and here is why anyone cared about this path".
Two details in the harness matter more than they look:
// Warm up first. The first call through a path populates pools and// caches, and counting those as the steady-state cost makes the// number both wrong and unstable.for i := 0; i < 20; i++ {b.run()}
First-call costs are real but they are not per-request costs. Including them makes the number higher and noisier, which is the worst combination: a budget you have to set loose and that still flakes.
The token verification case also runs with a nil database on purpose, so it measures the cryptography and the parsing rather than a session lookup. A budget is only useful if you know what is inside it.
And CI runs these without -race, because the race detector allocates on its own account and the resulting counts are not the ones your users get.
The part I got wrong
The first version of that file shipped with this comment:
An allocation count does not: the same code allocates the same number of times on every machine, every run.
The first half is true. The second half is not, and CI told me so within a day.
Token verification allocates 56 times under go1.26.9 and 41 under go1.27.2. Same code, same machine, same test. The newer runtime does the same work with fifteen fewer allocations.
I had set the budget to 50 from a local run on Go 1.27. CI pins 1.26.9. So it passed on the machine that wrote it and failed on the machine that judges it, which is the oldest mistake in performance work: measuring somewhere other than where the number is enforced.
The fix is a rule rather than a bigger number:
// It does move with the Go toolchain, and by more than you would guess.// Token verification allocates 56 times under go1.26.9 and 41 under// go1.27.2: the newer runtime does the same work with fifteen fewer// allocations. So a budget is set from the OLDEST toolchain the project// supports, because that is the one that allocates most, and both// figures go in the comment on the budget.
Budget from the oldest supported toolchain, because it allocates the most and is the binding constraint. Record every figure you measured, so the next person can tell a real regression from a toolchain difference. And check with the version CI actually uses:
GOTOOLCHAIN=go1.26.9 go test ./internal/handlers/
The failure message now says this out loud, because the right response to a failing budget is frequently "your Go version is different", not "your code got worse":
verify an access token now allocates 78 times per call under go1.26.9 linux/amd64,over its budget of 70.Why this path has a budget: runs on every authenticated request, so this one ismultiplied by all of your traffic.Before raising it, check whether this toolchain is simply different from the onethe budget was set on: run the same test under the Go version CI uses(GOTOOLCHAIN=go1.X.Y go test ./internal/handlers/).If the extra allocations are a deliberate trade, raise the budget in the samecommit, and put both figures in the comment so the new number is on the record.
Note the last line. A budget you are allowed to raise is the point, not a loophole. Sometimes the extra allocations buy something worth having. The test is not there to forbid that, it is there to make the new number a decision somebody recorded rather than a drift nobody saw.
How the budgets got chosen
Not by taste. By profiling a generated API under load and reading what the profile said.
Duration: 50.26s, Total samples = 145.81sflat flat% cum cum%20.55s 14.09% 30.68s 21.04% services.editDistance9.14s 6.27% 30.06s 20.62% runtime.concatstrings7.38s 5.06% 15.43s 10.58% runtime.mallocgcTinySC2
runtime.mallocgc and friends sitting that high in a profile is the signal that a workload is allocation-bound rather than compute-bound. When the garbage collector is a visible fraction of your CPU, the useful lever is allocating less, and the useful test is one that notices when you start allocating more.
Which is a general point about performance work: profile first to find out which resource you are short of, then write the test that guards that resource. Writing a latency assertion for an allocation-bound workload gives you a flaky test guarding the wrong thing.
What makes a metric gate-able
The trick generalises past Go. When you want CI to enforce a performance property, look for a metric with three properties:
It counts events rather than measuring duration. Counts are deterministic; durations include every other process on the box.
It is a property of the code, not of the environment. Ask what else could change it. Machine load, no. Go version, yes, which is why that one has to be pinned and recorded.
It moves when the thing you care about moves. Allocations correlate with GC pressure and tail latency. A metric that is stable but unrelated is a test that always passes.
Other metrics that qualify: query count per request (which is the N+1 detector as an assertion), bytes allocated per operation, goroutines spawned per request, and output size for a serialiser. Each is a count. Each moves when the code changes and holds still when it does not.
The ones that do not qualify are the obvious ones: wall time, CPU time, requests per second, p95. Those are worth measuring, worth graphing, and worth alerting on in production against a baseline. They are not worth failing a pull request over, because the number they report is partly about a machine you do not control.
The mistake is treating "we should test performance" as one problem. It is two. Measure durations in production, where the environment is the thing you care about. Assert on counts in CI, where the environment is noise.
Grit is a full-stack Go and Next.js framework. grit new my-app generates the allocation budgets in this post, wired into CI. Get started, or read about finding the line that is burning your CPU.
Founder of Grit and author of The Daily Grit. A 5-minute morning read on building full-stack apps with Go + React.
Build it with Grit
Go + React, batteries included. Scaffold a production-ready app in one command.
Get started